Presently, communication within most companies is fragmented. Financial communication for investors, the adoption of new accounting methods, oversight of management functions, and handling accounting and finance matters can be overwhelming and challenging to navigate and these tips to develop high-impact financial dashboards could greatly benefit your company.
Financial reporting holds immense significance as it enables companies, regardless of their size, from medium-sized enterprises to multinationals, to chart their future vision and direction based on key indicators. Additionally, adhering to the International Financial Reporting Standards (IFRS) necessitates providing a comprehensive overview of the financial status alongside any changes in accounting methods.
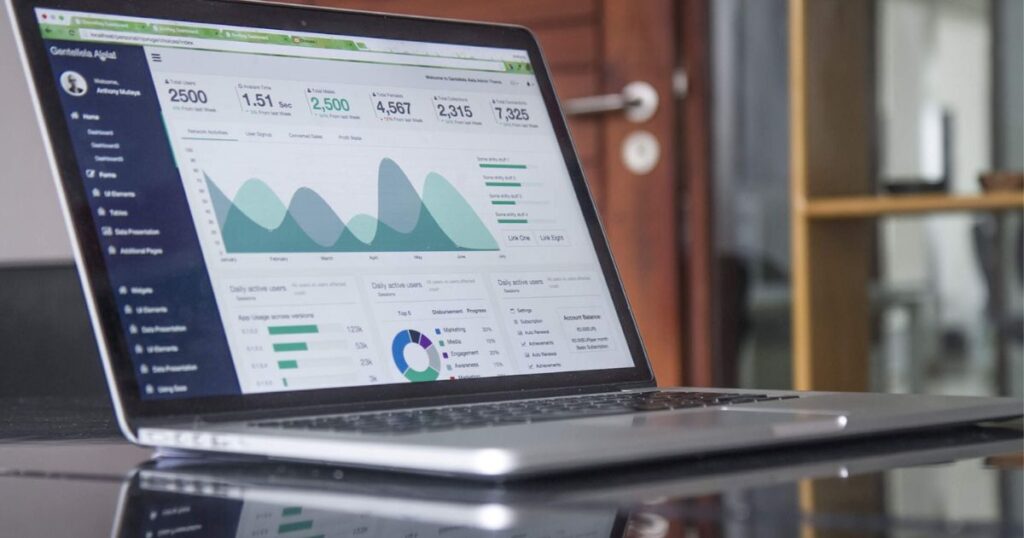
Importance of Financial Dashboards

Given this importance, an increasing number of financial executives are exploring the idea of investing in unified reporting, recognizing it as a crucial tool for informed decision-making.
In today’s business landscape, financial dashboards have become indispensable tools for businesses and organizations of all sizes. These dashboards play a crucial role in monitoring and tracking essential performance indicators, providing a comprehensive view of data from various departments and sectors. Consequently, executives, managers, and CEOs can glean vital insights, identify areas for improvement, and make informed strategic decisions.
If you are looking to create a financial dashboard for your organization, here are some essential guidelines at your disposal:
- Know What Your Users Need
Before embarking on the reporting process, consider the nature of your company, the industry it operates in, and the specific needs of your intended audience. To create an effective financial report, it is vital to comprehend the context and use cases associated with the data collected. Different departments and professions within your organization may require distinct sets of data, such as the primary sources of income, main cost factors, and key resources.
- Prevent Confusion Among Your Audience
While constructing a financial dashboard, the primary risk is drowning in an excessive amount of data. To avoid this, focus on the most relevant information available at the moment of report generation. Prioritize Key Performance Indicators (KPIs) to ensure that you deliver essential insights without overwhelming your audience. Simplicity is crucial for effective communication and decision-making. A clear presentation with contextualized and relevant data is more impactful than crowded visuals.
- Choose Appropriate Key Performance Indicators (KPIs)
Define the goal of your financial reporting—is it to support specific projects, provide an analytical view of the company’s activities, or offer an overview of key financial indicators at a particular time? Embrace data visualization technologies to create graphics and interactive dashboards that allow easy navigation through vast databases. During presentations, adopt data storytelling to help the audience understand the reasons behind fluctuations in data. Each KPI should convey a clear message about the company’s performance.
- Consistent Updates are Vital
Consider your financial report as an ongoing part of the decision-making process, not a final product. Periodically and consistently update your dashboard to reflect changes in the environment, projects, goals, and constraints. A well-maintained dashboard aligns decision cycles with reporting, transforming it into a valuable tool for monitoring company performance.
- Single Indicator Display on Each Screen
Avoid the common mistake of presenting too many indicators and graphics on a single screen. To facilitate quick understanding and decision-making, display one main message per visualization on separate, concise slides. Making information accessible and easily digestible is crucial, especially when your audience may not be familiar with complex formats.
Types of Strategic Dashboards
There are numerous charts to use with data-driven maps to build your company’s financial dashboards:
- Marketing Dashboard
A marketing dashboard serves as a valuable tool to display both soft metrics (engagement, awareness, interactions, etc.) and hard metrics (e.g., internal rate of return and the net present value of ongoing campaigns) alongside online marketing data (e.g., bounce rate, total visits, click-through rates). Incorporating a marketing dashboard offers numerous benefits for your business. Here are a few reasons why it’s highly advantageous:
- Venture Financing Dashboard
For venture capital investors, maintaining accurate and up-to-date information about portfolio companies and investment data is crucial. This facilitates data-driven investment decisions, enhances portfolio support, ensures compliance with audit requirements, and impresses limited partners (LPs).
- Sales Performance Dashboard
In the realm of sales, there is an abundance of data to track, including deals won, revenue generated, opportunities lost, emails sent, and calls made. To efficiently manage a sales team, a system is needed to track key performance metrics in real time and present the data in a visually engaging yet simple manner.
- Wealth Management Dashboard
Individuals with substantial wealth are typically in their 40s or 50s, having accumulated riches over time. They often manage their investment portfolios through wealth management services that provide tailored solutions. On the other hand, a new generation of investors is amassing significant wealth, but they lack the appropriate tools to allocate it effectively. These investors seek direct access to real-time or near-real-time information and actionable insights based on that data.
- Business Operation Monitoring Dashboard
This dashboard visualizes key performance metrics, enabling businesses to enhance operational performance. To be effective in driving performance improvements, operational dashboards should be streamlined, containing only necessary data for making quick, real-time decisions. This reduces the risk of overlooking critical performance anomalies that could lead to financial losses.
- Investment Portfolio Dashboard
An investment portfolio dashboard is a computer software program designed for managing and auditing a pool of investments dedicated to various business projects. It tracks and measures investment activity using key performance indicators. The dashboard allows organizations to report on asset performance to owners, investors, sponsors, and other stakeholders.
- Sales Management Dashboard
This provides a digital representation of information regarding the status of a particular system or service. It includes essential data such as time, battery levels, and current GPS location. Additionally, it incorporates specific data related to sales.
FINAL WORDS
Building a financial report requires presenting data in a comprehensible manner for all stakeholders. Selecting relevant information, prioritizing simplicity, and keeping the report updated are vital steps in ensuring that your financial dashboard becomes a powerful tool for driving informed decisions without confusion or overload.
FAQs
What defines an effective financial dashboard?
An effective financial dashboard goes beyond visualization, enabling powerful finance analytics and unified data exploration. It combines diverse data sources for a complete and accurate financial overview.
How do KPIs and dashboards contribute to financial condition analysis?
KPIs on financial dashboards offer a monitoring and analysis platform for management. They track performance at various levels, highlight trends, and provide alerts for KPIs surpassing set thresholds.
How would you describe a financial dashboard?
A financial dashboard is a tool that aids organizations in analyzing financial performance, facilitating historical data comparisons, and providing insights.
What is the primary goal of a financial dashboard?
The main objective of a financial dashboard is to present key financial goals and metrics, serving as a central hub to assess an organization’s financial health and performance.


